
A College Waitlisting Model
May 4, 2014
Suppose a selective college wants $N_0$ students in their freshman class. How many students should they admit, and what's the distribution of the number of students they'll admit off the waitlist? Of course, you could just look for data from previous years, but in the fast-changing world of college admissions, data goes stale quickly. And honestly, I really enjoy simple probability models!
Suppose that each admitted student matriculates with some probability $p$, independently of all the other admits. The independence assumption sounds pretty reasonable to me--students each decide separately whether to matriculate, even if, admittedly, some of the random inputs to that decision are shared, like their experience on visit day. The equal matriculation probability assumption is definitely not true, as the top-ranked, stronger admits are less likely to matriculate than low-ranked, weaker admits at the margin, but the results we'll get with this assumption will be at least qualitatively right.
Thus, if the school admits $n$ students, $N \sim \text{Bin}(n, p)$ will matriculate, or roughly $\mathcal{N}(np, np(1-p))$. The school is going to end up admitting about $N_0/p$ students, so let's simplify a little bit by assuming that the variance $\sigma^2 = np(1-p)$ is roughly $N_0(1-p)$.
Schools would rather admit too few students, filling up the remaining $N_0 - N$ slots with applicants on the waitlist. This is because the alternative, admitting too many students, requires them to scramble to find beds for the extra $N - N_0$ students. Therefore, let's suppose that the school's loss function is asymmetric: suppose a cost of 1 per student it needs to admit off the waitlist if too few students matriculate, and a cost of $K$ per extra student it needs to find a bed for if too many students matriculate. (Note that the cost of 1 is without loss of generality, since we can choose the units for the cost, and that we're thinking about $K$ as larger than 1).
The admissions office chooses $n$, the number of admitted students, to minimize this loss. You can show that the optimal choice of $n$ is such that $N_0$ is the $\frac{K}{K+1}$ quantile of a $\mathcal{N}(np, N_0(1-p))$. This gives us $$ n = \frac{N_0}{p} - \frac{\sqrt{N_0(1-p)}}{p}\Phi^{-1}\left(\frac{K}{K+1}\right), $$ where $\Phi$ is the standard normal cumulative distribution function.
$n$ decomposes nicely into two terms: The first, $\left(\frac{N_0}{p}\right)$, is the number of students the school would admit if they weren't afraid to overshoot their class-size target, (ie, with $K = 1$). The second term is the "fear-correction": because the school doesn't want to be overbooked, it admits fewer than it otherwise would. Note that the fear-correction term is of order $\sqrt{N_0}$ smaller than the main term, justifying the earlier constant-variance simplification.
As you'd expect, $n$ increases with $N_0$, the target class size. And as $K$ gets larger, colleges are more afraid of having too many people matriculate, and so admit fewer people. As the yield rate $p$ increases, colleges admit fewer students, though the fear-correction decreases because the college is more confident about the number of admitted students who will matriculate.
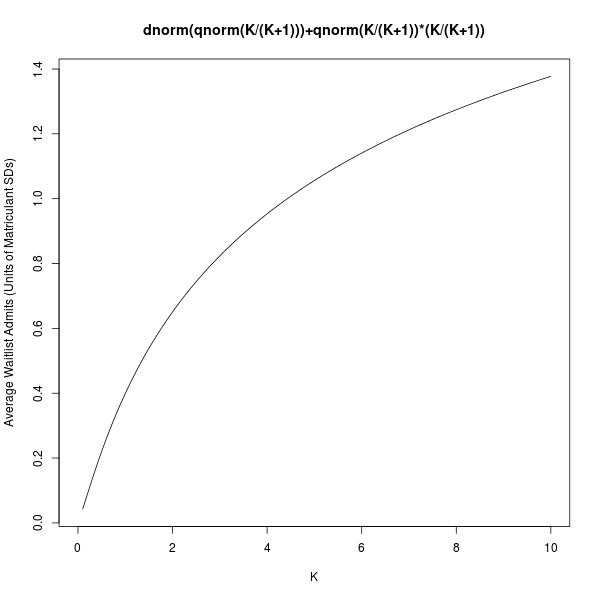
The number of people admitted off of the waitlist is the total undershoot, $(N_0 - N)^{+}$, (assuming everyone accepts if they're admitted off the waitlist). In particular, with probability $\frac{1}{K+1}$, nobody gets admitted off of the waitlist, and with probability $\frac{K}{K+1}$, the distribution of people admitted off the waitlist looks like a truncated normal distribution. With some painful integration, one can even find the mean of this distribution; the expected number of waitlist admits is: $$ \sqrt{N_0(1-p)}\left[\Phi^{-1}\left(\frac{K}{K+1}\right)\left(\frac{K}{K+1}\right) + \phi\left(\Phi^{-1}\left(\frac{K}{K+1}\right)\right)\right], $$
where $\phi$ is the standard normal density. This looks somewhat daunting, but it's really just the standard deviation of the number of matriculants, $\sqrt{N_0(1-p)}$, times a term that depends only on the extra student cost $K$. We see that a college with a higher class-size target $N_0$ admits more people off the waitlist on average, and that colleges with higher yields $p$ tend to admit fewer students off the waitlist. The function of $K$ looks like this:
The parameters $N_0$ and $p$ can be found online; they are (approximately) the number of students in each freshman class and the college yield rate. $K$ is harder--schools don't publish the parameters they use in their utility functions!--but under this model we can instead estimate $\frac{1}{K+1}$, the probability that a school takes nobody off the waitlist, using historical waitlist data. Using data from the New York Times, I found that in 2011, out of 29 selective schools with available data, 10 didn't admit anyone off the waitlist. In 2012, out of 28 selective schools with available data, 7 admitted nobody off the waitlist. Aggregating this, we get a value of $\frac{1}{K+1}$ to be 17/57, (30.%), or $K \approx 2.4$. (Of course, each school presumably has it's own value of $K$, but aggregating them like this should at least give us a reasonable typical value).
Let's do an example: In 2013, Harvard admitted 2047 applicants, of whom 1659 (81.0%) matriculated, and then another 20 students off of the waitlist. Thus, if for Harvard we use $N_0 = 1679$, $p = 0.81$, and we use $K = 2.4$, then our model says that Harvard should admit 2060 students, (fear-corrected down from 2072), and (more interestingly!) that the distribution of students admitted off the waitlist should look like this:
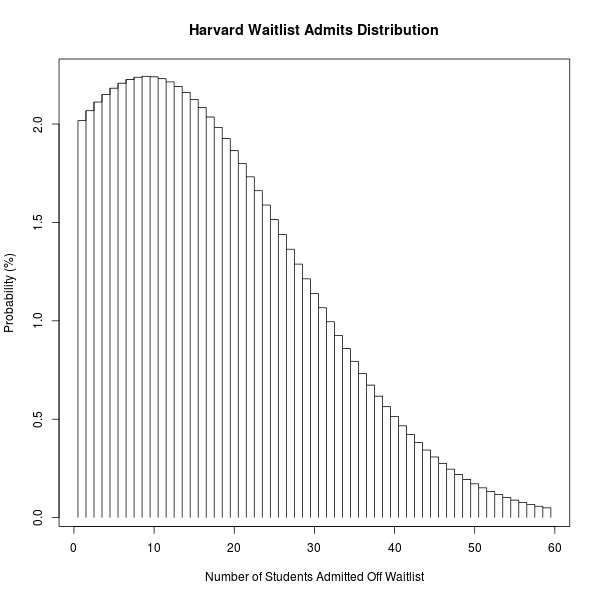
(The mass function for 0 students isn't plotted because the model predicts it to be at 30%, way off the chart).
The expected number of waitlist admits for Harvard is 13.0, which you can find from the formula above, or the plot below, where I've plotted the expected number of waitlist admits for any school with some target class size and yield rate $p$:
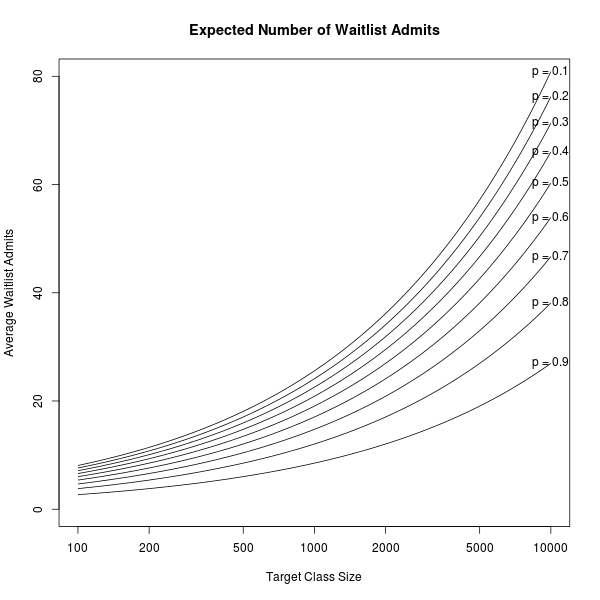
So there you have it: Plug in the numbers for your school of choice to see how the distribution of waitlist admits looks!
